Table of Contents
Data Transfers
Monthly Overviews
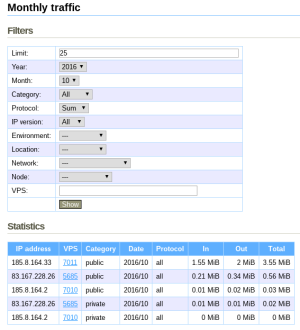
In the “Networking → List monthly traffic” menu, we can check the monthly overviews of transferred data.
Under default settings, transfers for all VPS for the current month are displayed.
Using a filter form, it is possible to only display transfers from the past, choose a specific VPS, node, location, etc.
Real-time Transfer Monitor
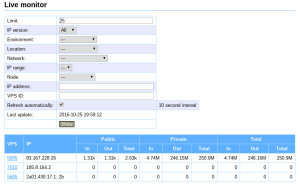
vpsAdmin measures transferred data every 10 seconds and uses that data to calculate the average for one second. You can display it either in the “Networking → Live monitor” menu or using vpsfreectl.
Web Monitor
CLI Monitor
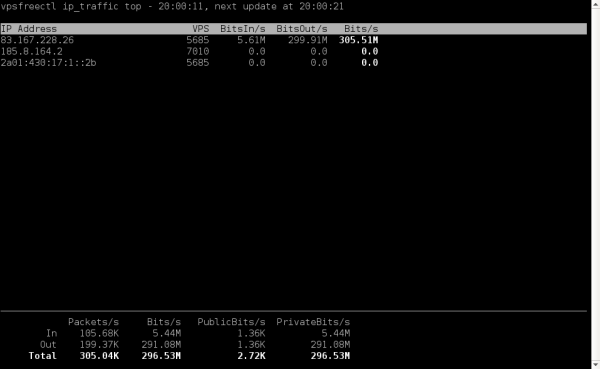
vpsfreectl contains the network top command, which runs a
TUI application similar to iftop
$ vpsfreectl network top --help
...
    -L, --list-parameters            List output parameters
    -o, --output PARAMETERS          Parameters to display, separated by a comma
...
Command options:
        --unit UNIT                  Select data unit (bytes or bits)
        --limit LIMIT                Number of IP addresses to monitor
        --user ID                    Filter network interfaces by user
        --environment ID             Filter network interfaces by environment
        --location ID                Filter network interfaces by location
        --node ID                    Filter network interfaces by node
        --vps ID                     Filter network interfaces by vps
        --network-interface ID       Filter network interfaces by network_interface
    -h, --help                       Show this message
The program can be controlled using the arrow keys The left and right arrow keys change the column according to which
the addresses are ordered. The up and down arrow keys then reverse the order, i.e.
whether it’s ascending or descending. The program is terminated using the q key.
Options other than -o and -L have to be separated from vpsfreectl arguments using two
dashes --. You can use the --unit option to choose whether the
program will display transfers in bytes per second or bits per second (default
setting).
Examples:
$ vpsfreectl network top -- --unit bytes

$ vpsfreectl network top -- --vps 1234


